Docs / ORGANIZATION
Global Organisation Dashboard
The Global Administration Dashboard gives administrators a consolidated view of security performance across all Workspaces in one place.
What you'll find here
For each security control (such as Multifactor Authentication, Endpoint Protection, Vulnerability Management, and others), the dashboard displays all metrics generated across every Workspace you manage.
Example:
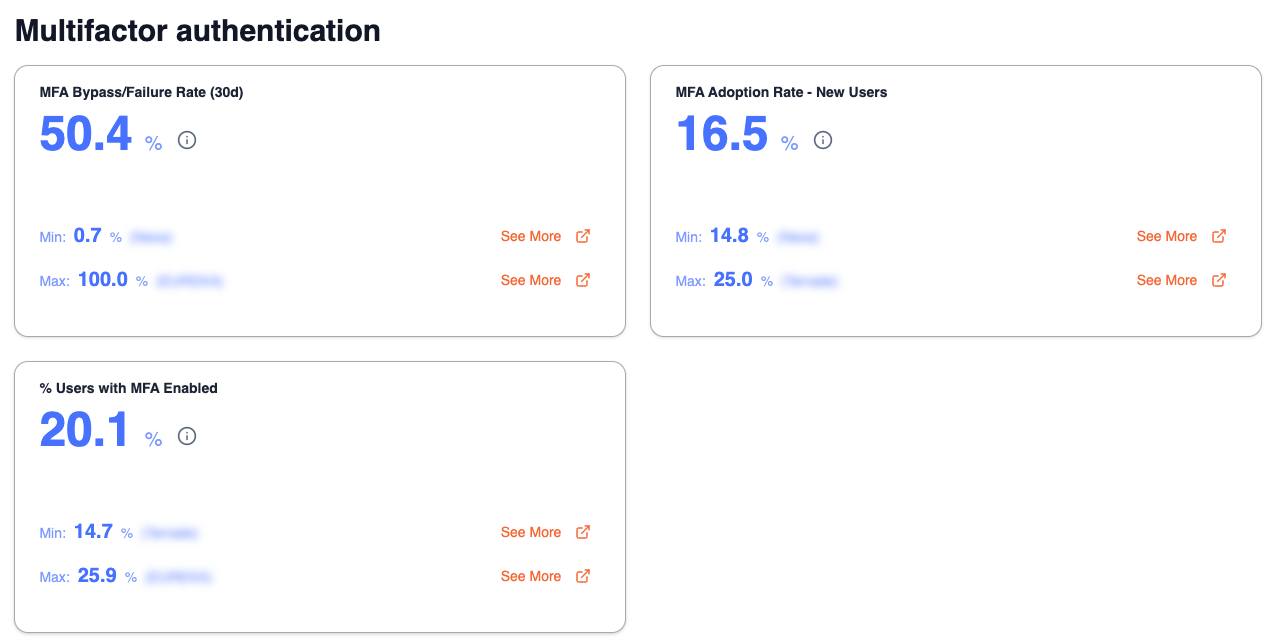
How metrics are displayed
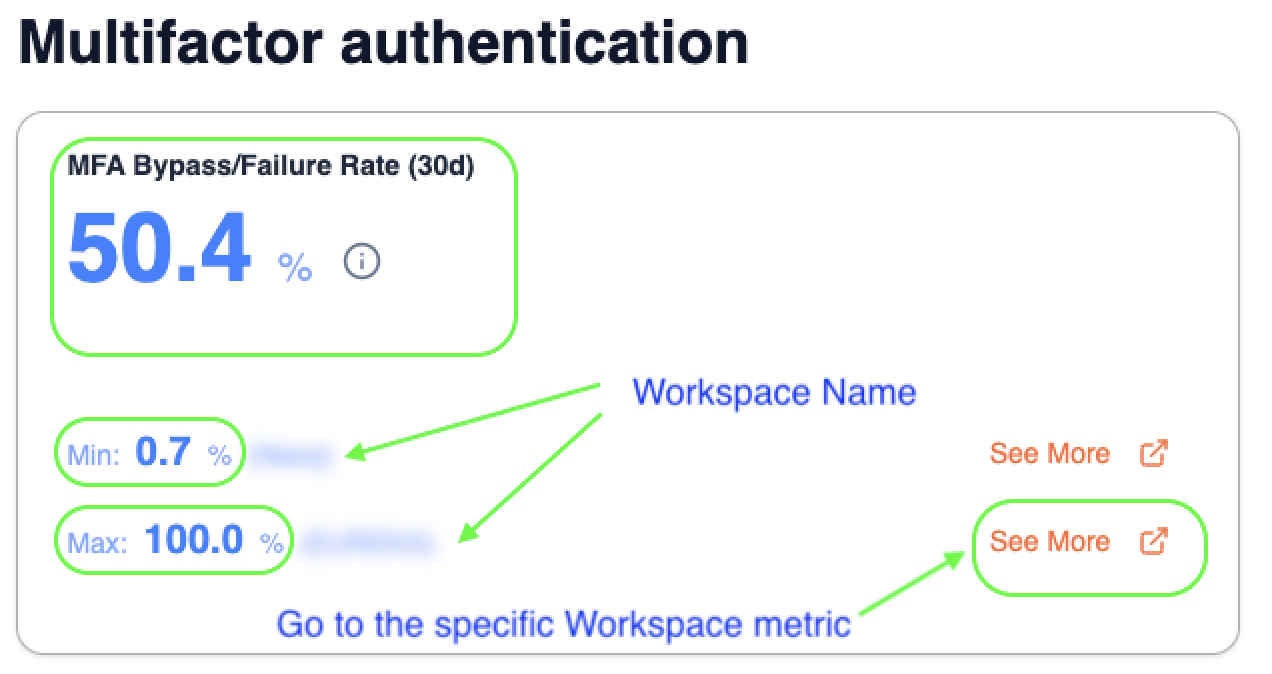
Each metric shows a single value ( expressed as a number or percentage ) that represents the median across all your Workspaces. This allows you to quickly assess your organization's overall posture without reviewing each Workspace individually.
For each metric you can also see:
Min – the lowest value recorded across all Workspaces
Max – the highest value recorded across all Workspaces
See More – drill down into the specific Workspaces driving that value
When to use it
The Global Administration Dashboard is most useful when you need to:
Spot which controls are underperforming organization-wide
Compare Workspace performance at a glance
Identify outliers : Workspaces with unusually high or low values (using the Min/Max indicators)
Report on overall security posture across your entire client base
Was this helpful?