Docs / METRICS
Workspace Dashboard
Each workspace has a dedicated metrics dashboard that shows the performance of deployed security controls over time.
Use it to monitor trends and prioritize remediation.
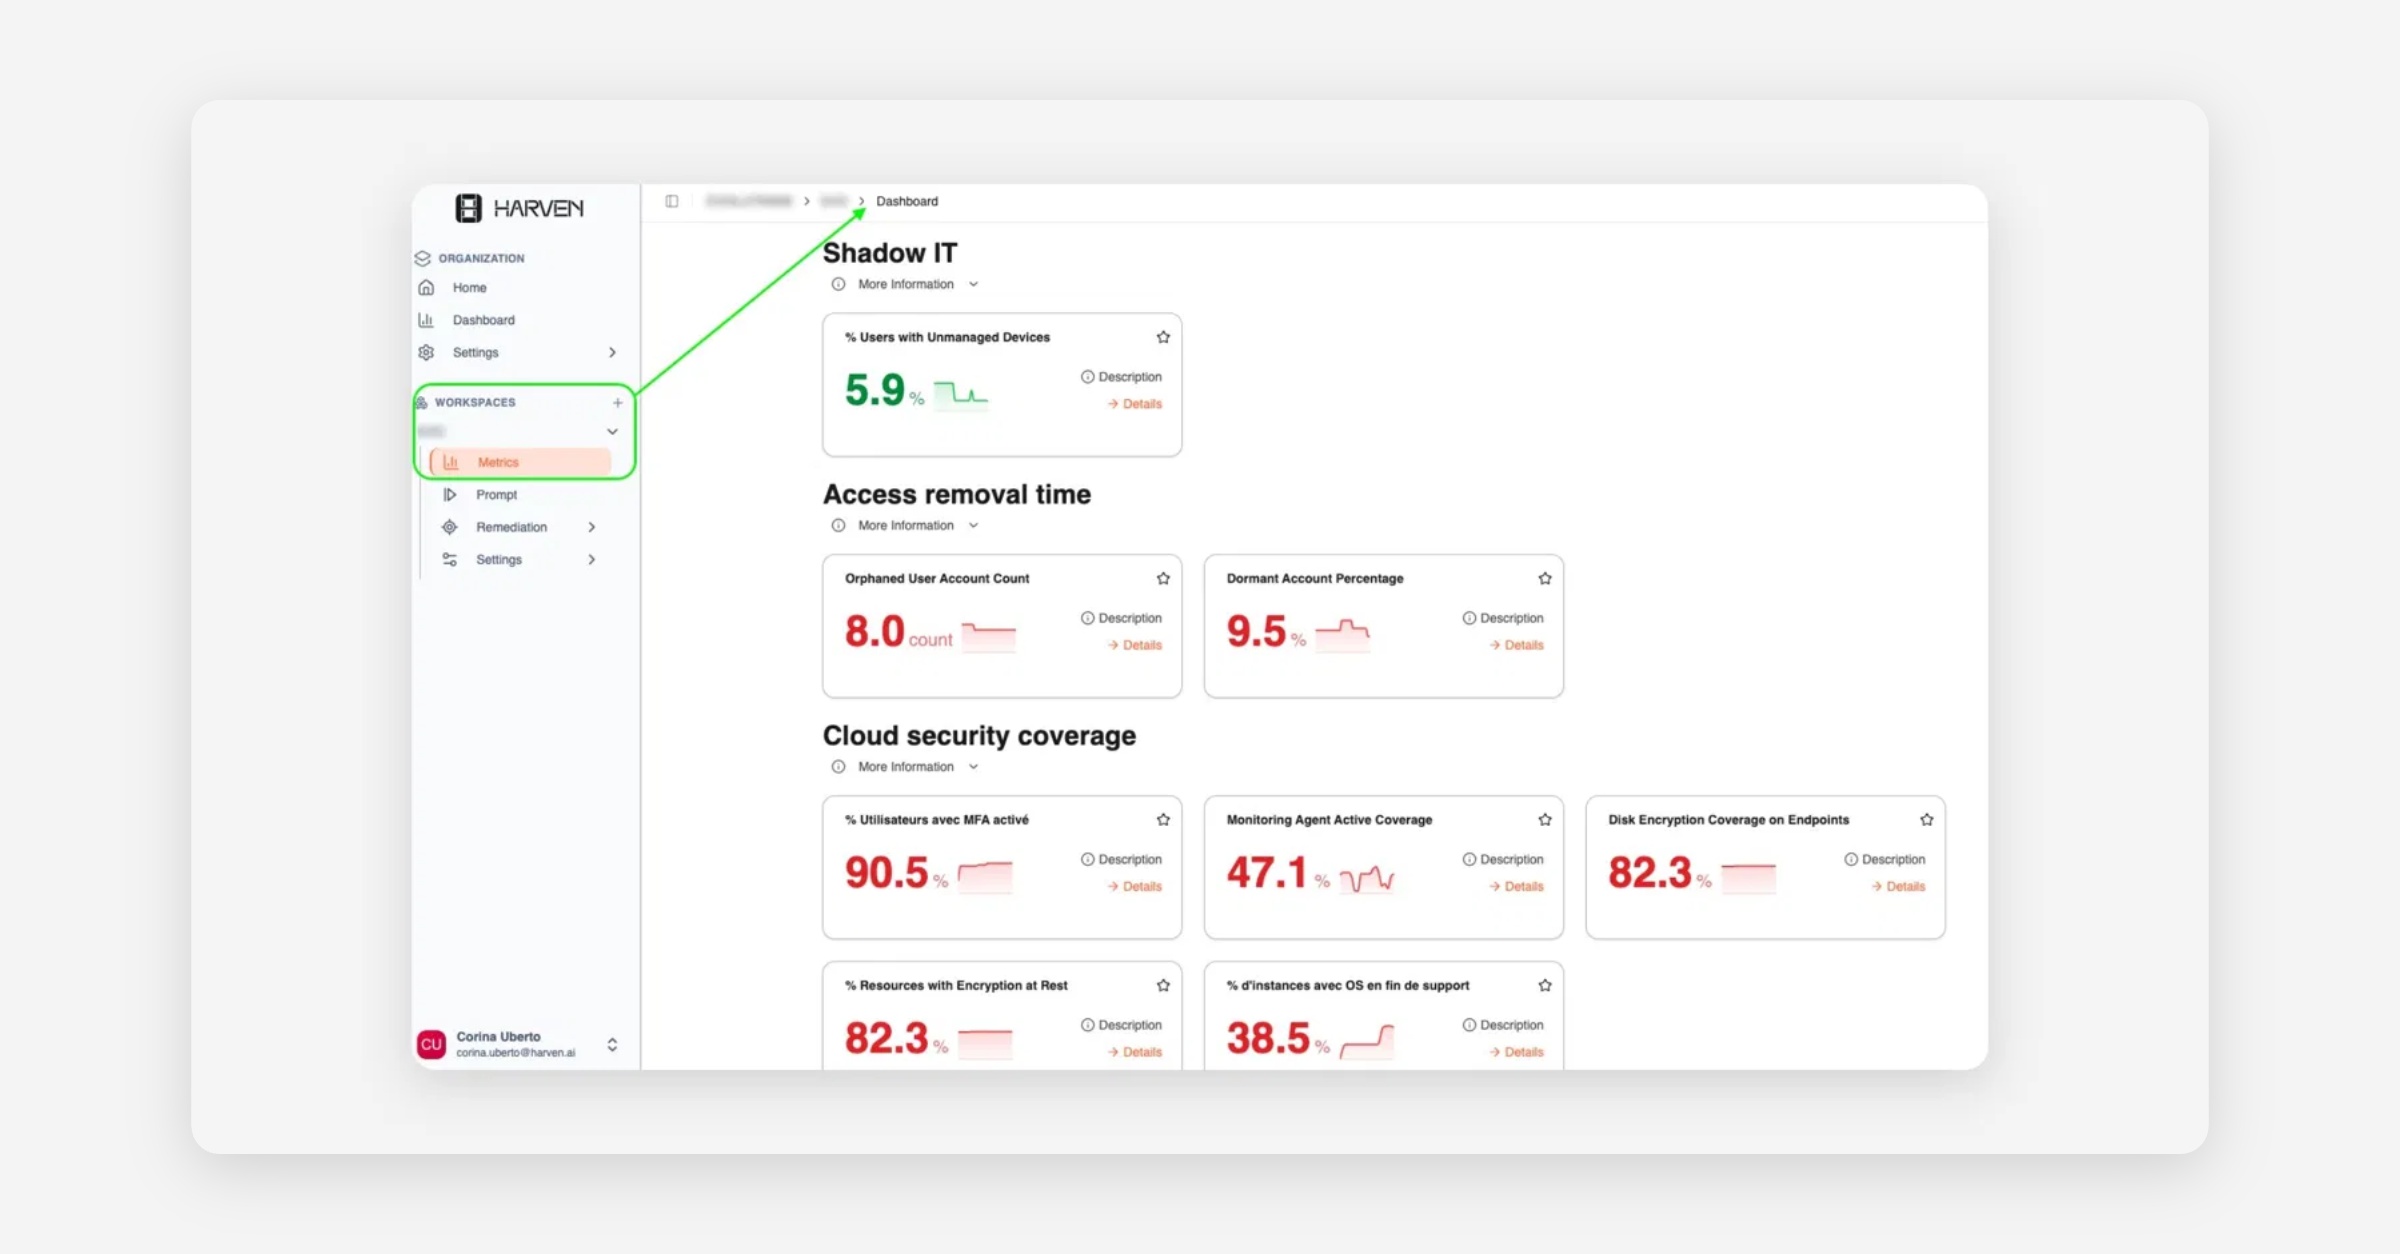
How to get there?
Workspaces→ your workspace → Metrics
What you'll see:
Metrics Grouped by control
Current value : Each card shows the latest figure, a count or a percentage , depending on the control type.
Timeline sparkline: A chart shows how the metric has evolved over time.
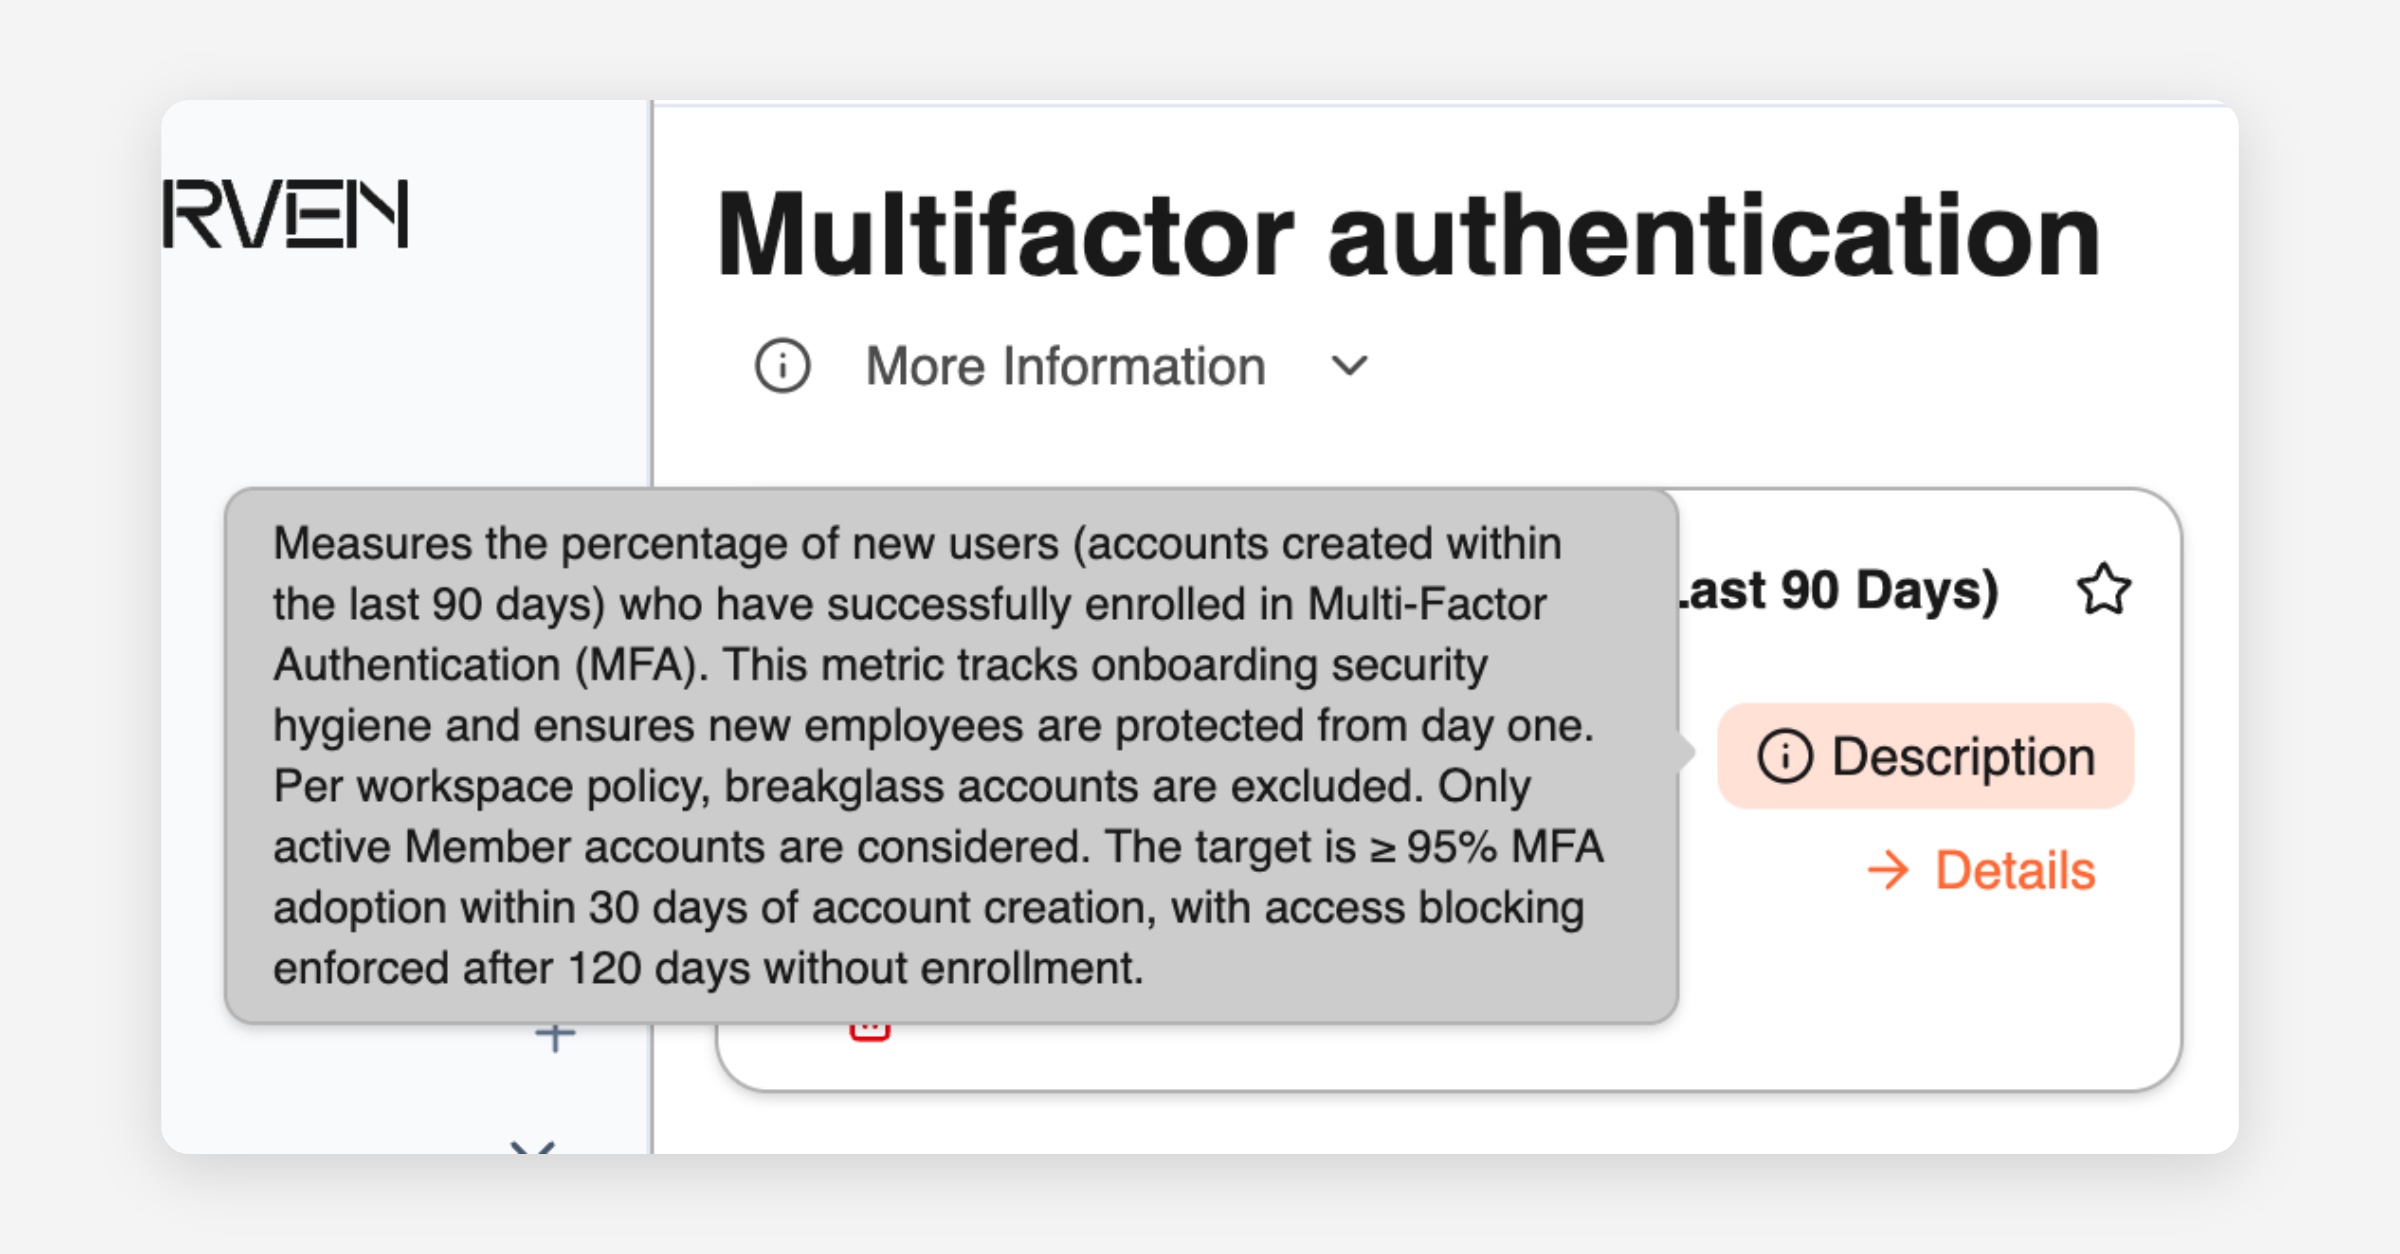
Metric description: whit information about how it’s measured, the success criteria and why it matters. Eg:
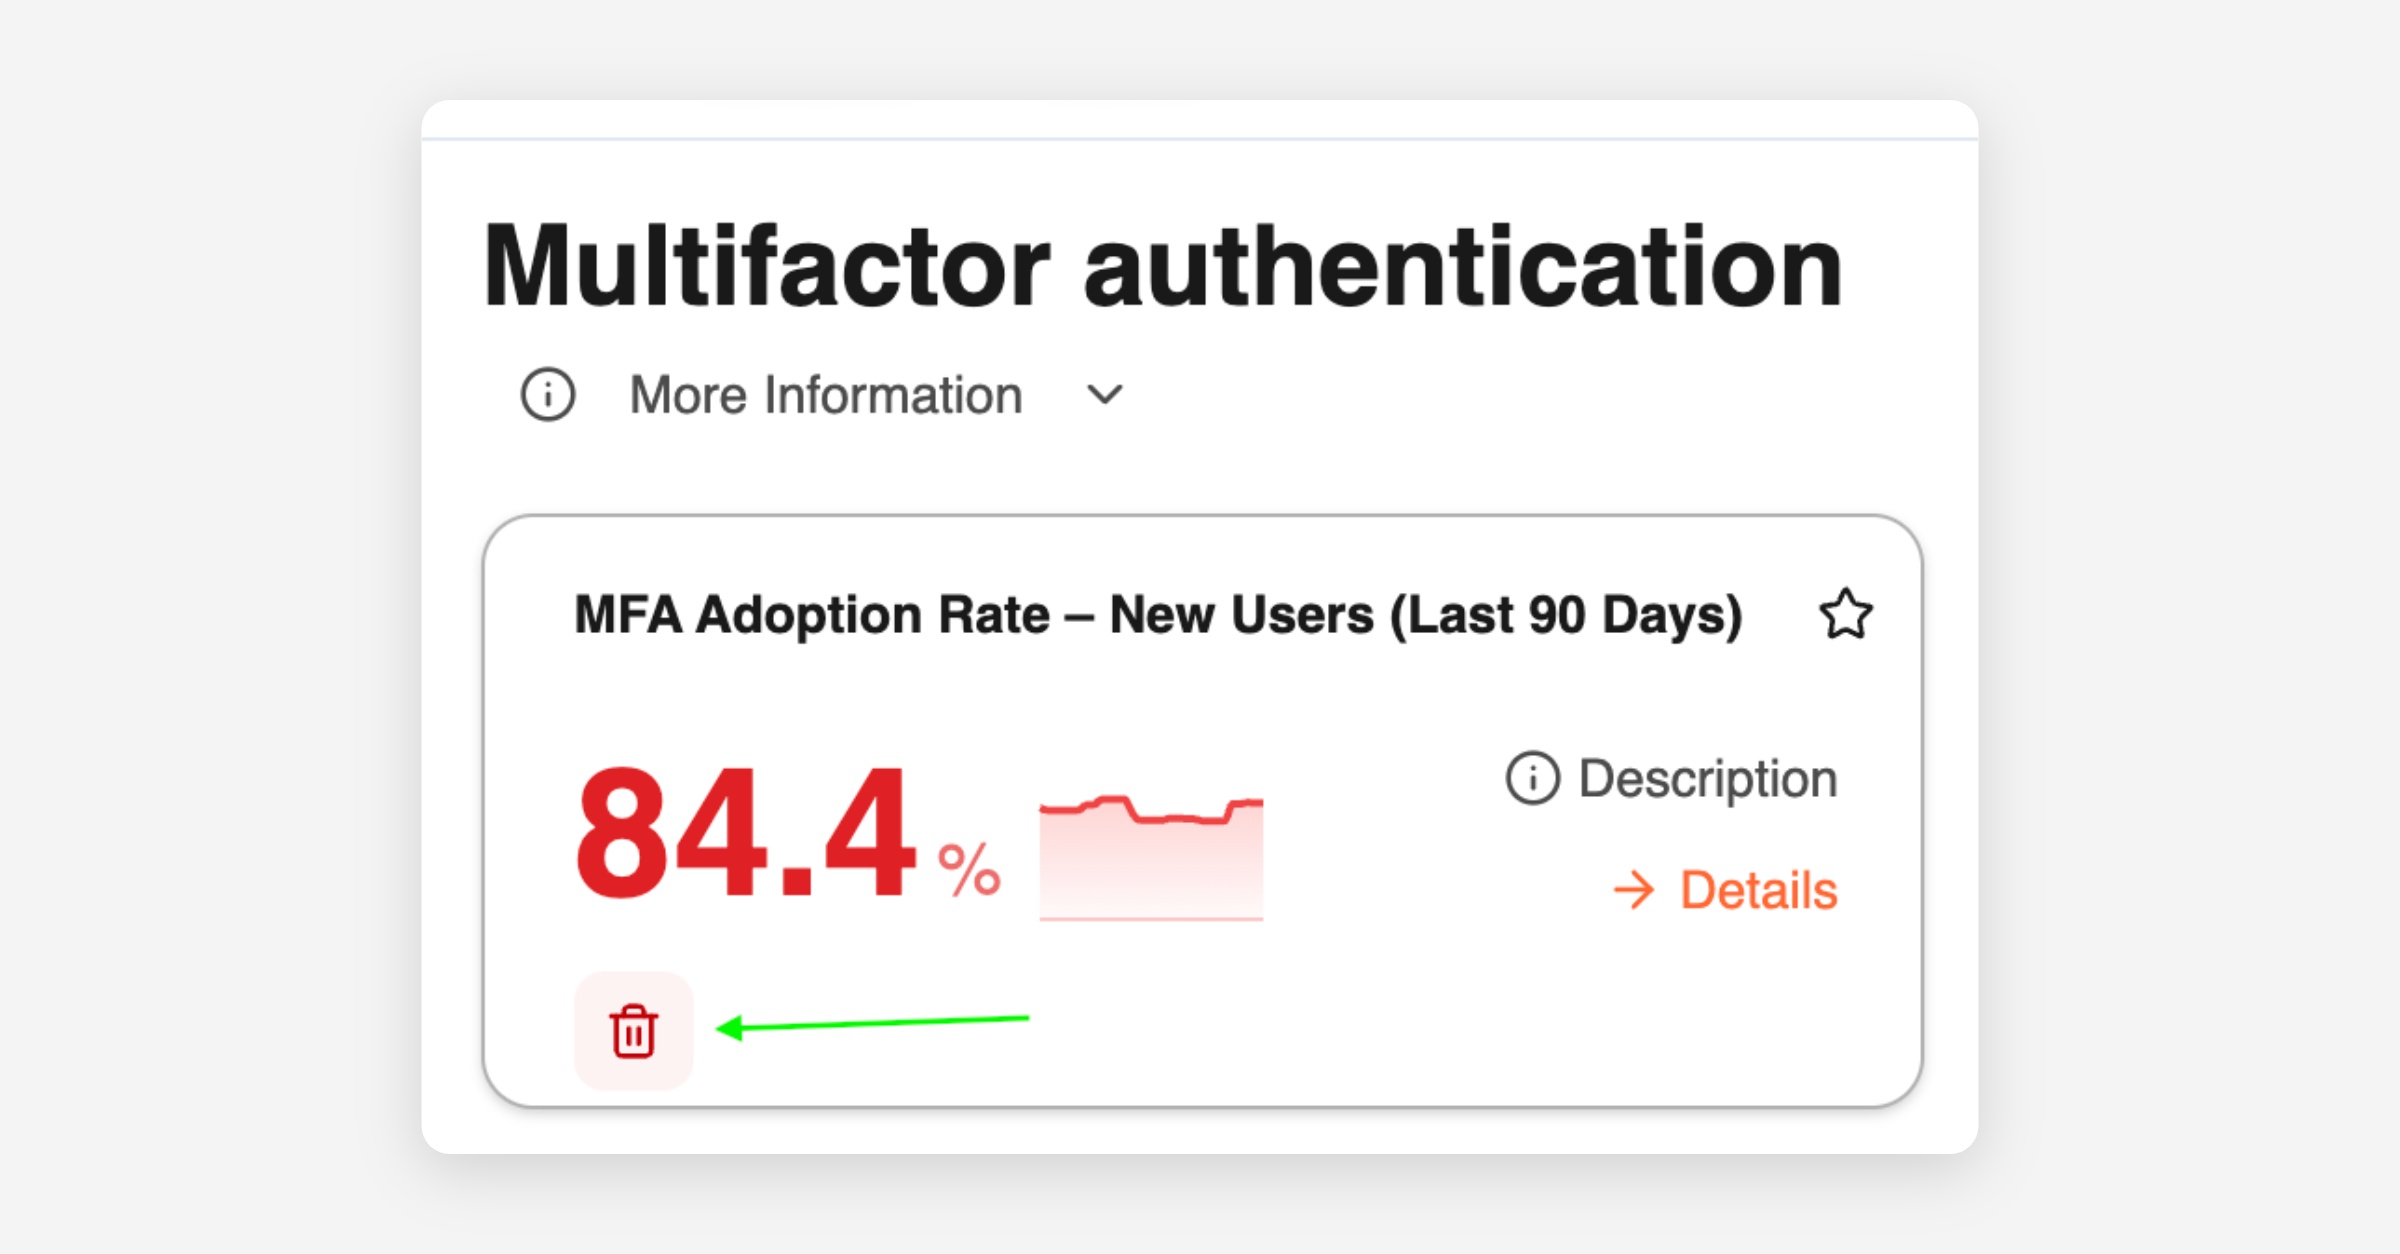
Remotion option: You can remove any metric card that isn't relevant to your workspace. The remove option appears only when you hover over the card, keeping the dashboard clean and uncluttered.
Color status : Values are colored based on whether the metric meets the target defined in your workspace settings :
green means on target
red means improvement is needed.
Click → Details on any metric card to see more particular info
Was this helpful?