Docs / METRICS
Exploring Metric Details
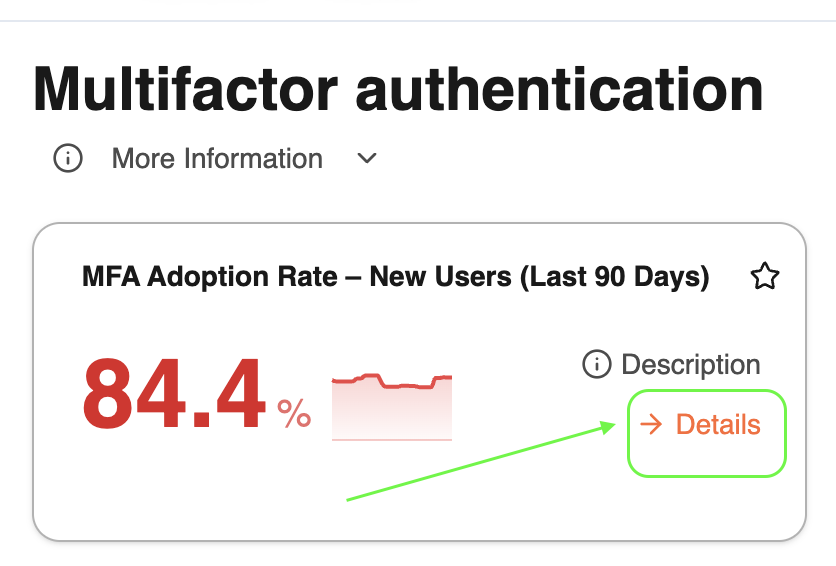
Click → Details on any metric card to open the full historical view. From here you can explore trends over time, understand how the metric is calculated, customize the underlying SQL query, and more.
Filter by time period
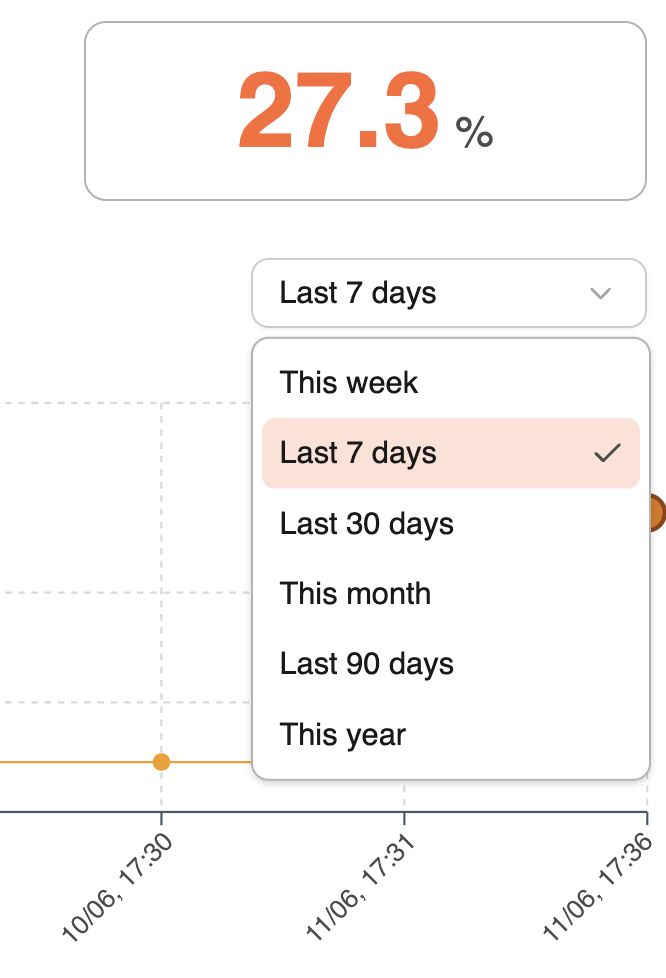
Once you are in a specific metric section, you can select a time period
Use the dropdown at the top right to filter the chart by period : this week, last 7 days, last 30 days, this month, 90 days or this year.
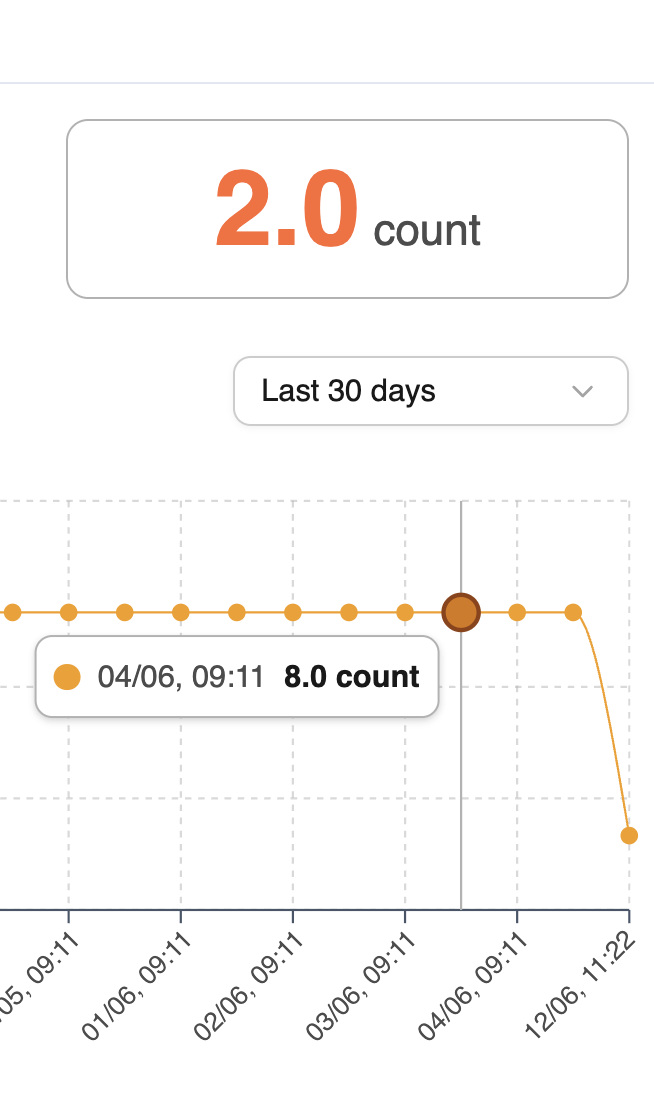
Hover any data point
Each point on the line shows the result for that specific day, including the report at the end of the page.
What you'll find in the Metric Details section
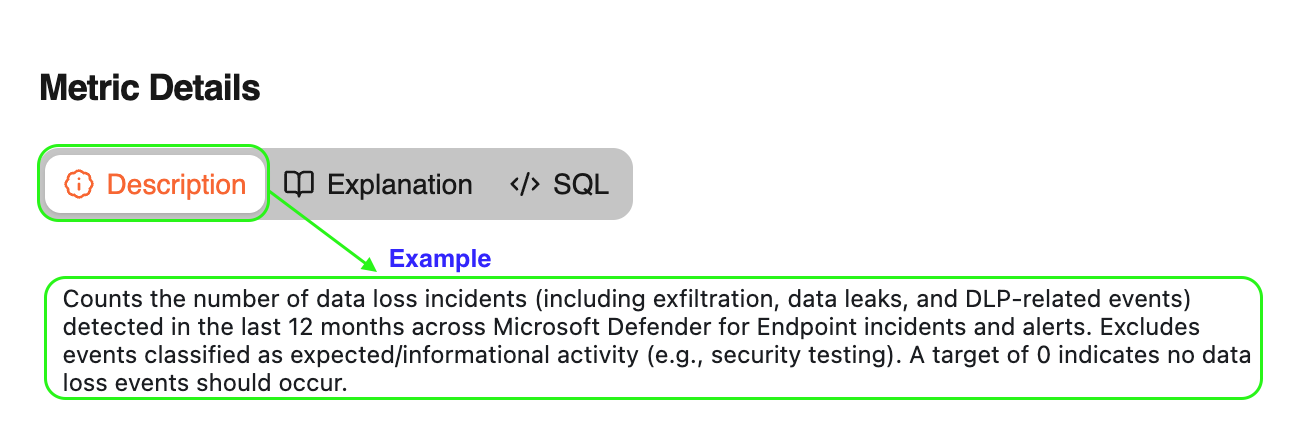
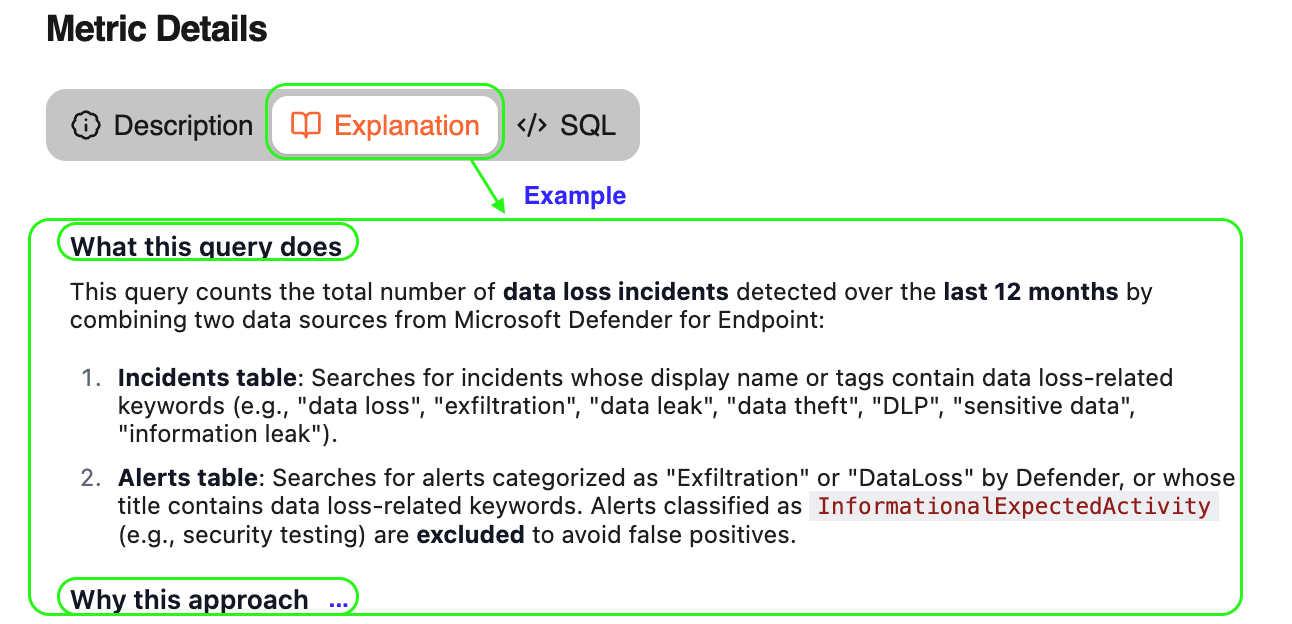
Description
A global description of the metric and a complete explanation of how the SQL query is generated.
🤖 🪡 Remember that every HARVEN’S SQL query is custom-tailored to your needs
A complet explanation on how the SQL is generated.
A simplified version of the SQL query is displayed along with its creation date. Click the date to browse previous versions.
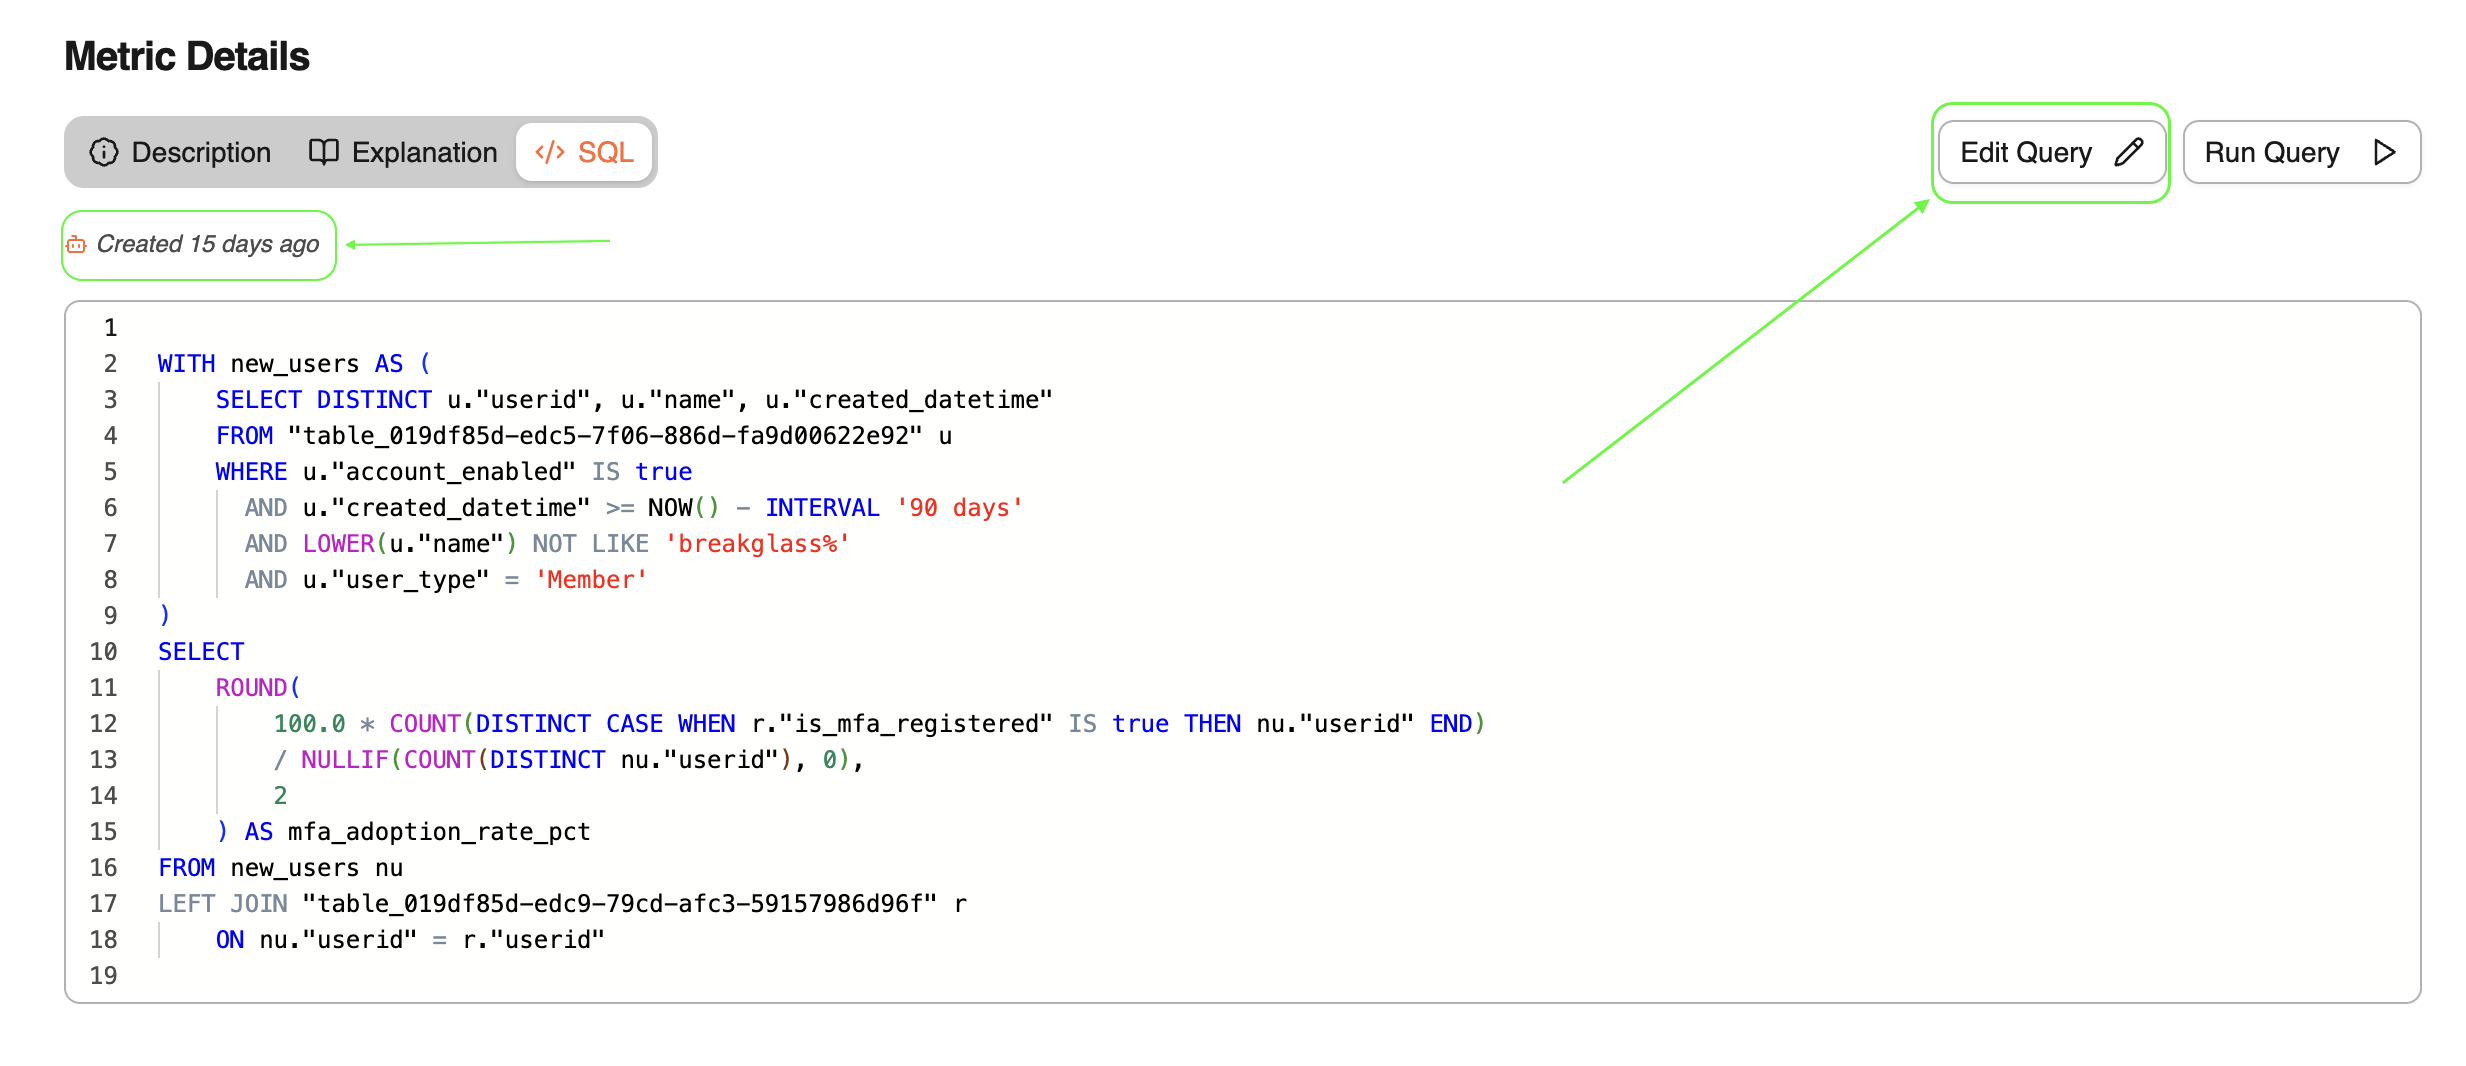
To modify the query, click Edit Query. This opens the full SQL editor where you can make changes and save your new version. Click Run Query to preview the results before saving.
You can click on ‘Run query‘ to check your new results.
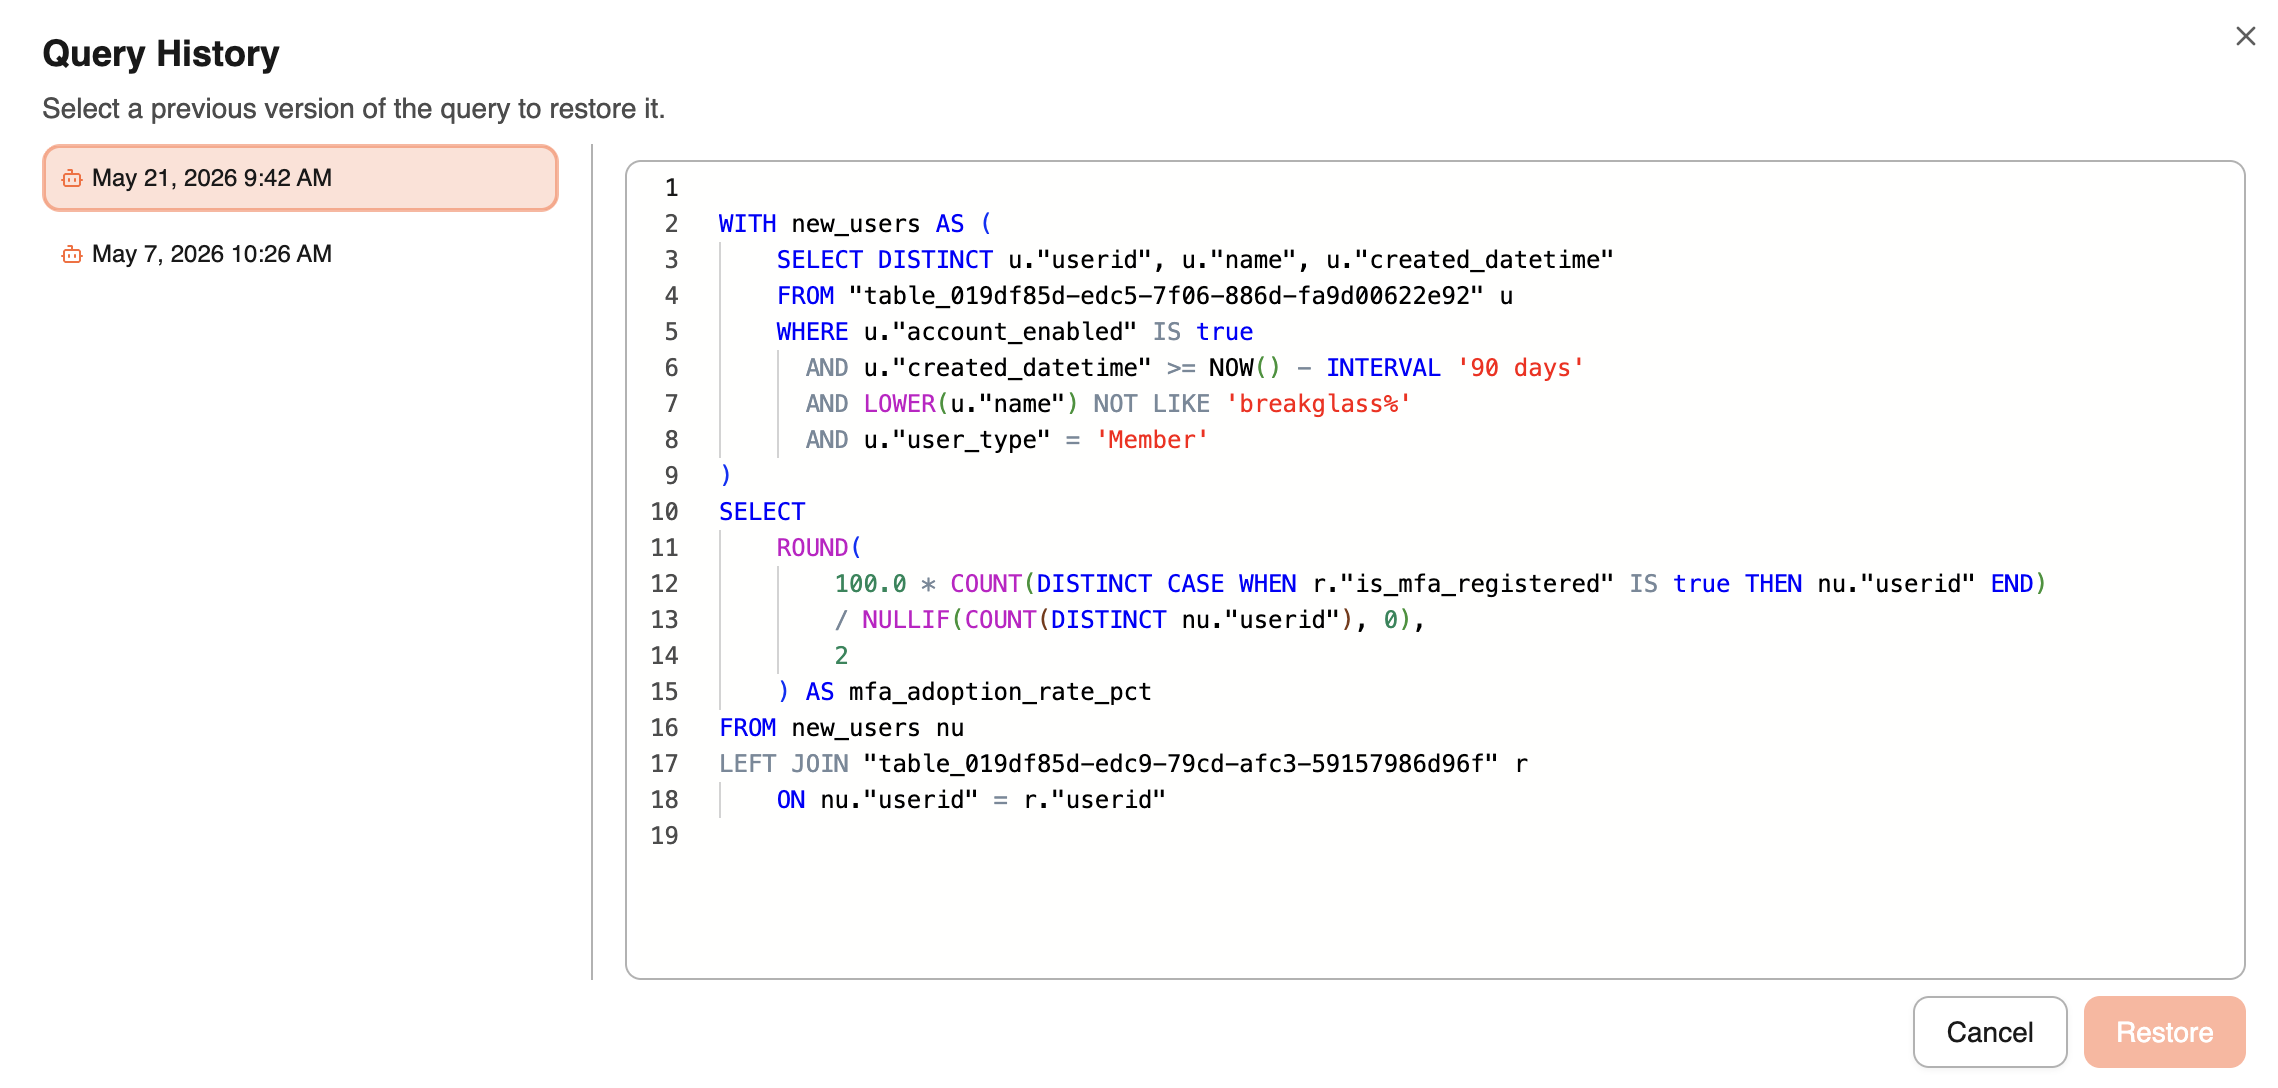
If you need to restore the previous version: click in the SQL date information → select your target version and then → restore
At the end, you will find a list of sugested prompts linked to that metric to refine your investigations. learn more about here:
https://support.harven.ai/docs/prompt/using-prompt-suggestions
Was this helpful?